
SHRINKAGE IN IIP RECORDED THE LOWEST IN 8 YEARS
12, Nov 2019
Prelims level : Industries – Textile, E-Commerce, Pharma, Service
Mains level : GS-III Effects of liberalization on the Economy, Changes in Industrial Policy and their effects on Industrial Growth.
Why in News?
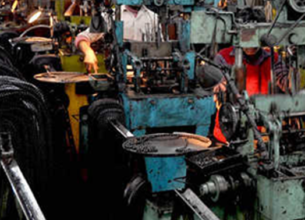
- According to official data released recently, Industrial activity in September contracted sharply by 4.3%, a historical low, driven by major slowdowns in the capital goods, mining, and manufacturing sectors.
Historical Shrinkage:
- The contraction in the Index of Industrial Production (IIP) in September was compared with the contraction of 1.1% in August. The Index had grown 4.3% in September of the previous year.
- “This is the first time after November 2012 that all three broad-based sectors have contracted and the lowest monthly growth in the 2011-12 base year series. “In the old (2004-05) base, IIP in October 2011 contracted by 5%.”
- “The Indian economy is presently facing a structural growth slowdown originating from declining household savings rate, and low agricultural growth”.
- “Low agricultural growth is feeding into low agricultural and non-agricultural wage growth in rural areas, which is impacting rural demand adversely.”
| Various Sectors | Growth rate in September (%) | Growth rate in August (%) |
|---|---|---|
| Capital Goods Sector | Decreased by 20.7 | Decreased by 21 |
| Mining Sector | Decreased by 8.5 | Increased by 0.1 |
| Manufacturing Sector | Decreased by 3.9 | Decreased by 1.2 |
| Electricity Sector | Decreased by 2.6 | Decreased by 0.9 |
| Consumer Durables Sector | Decreased by 9.9 | Decreased by 9.1 |
| Consumer Non-durables Sector | Decreased by 0.4 | Increased by 4.1 |
About IIP:
- IIP is a composite indicator measuring changes in the volume of production of a basket of industrial products over a period of time, with respect to a chosen base period.
- It is compiled and published on a monthly basis by the Central Statistics Office (CSO) under the Ministry of Statistics and Programme Implementation with a time lag of six weeks from the reference month.
- Base year for IIP is 2011-2012 (Earlier 2004-05) i.e. it is calculated on the basis of their share of GDP at factor cost during 2011-12.
- The revised IIP (2011-12) reflects the changes in industrial sector and also aligns it with base year of other macroeconomic indicators like Wholesale Price Index (WPI) and Gross Domestic Product (GDP).
- IIP covers 865 (Older series 682) items comprising :
1.Manufacturing (809 items, Older series 620 items) – 77.63%
2.Mining (55 items, Older Series 61 items) – 14.37%
3.Electricity (1 item) – 7.99%
- The eight Core Industries comprise nearly 40.27 % of the weight of items included in IIP. They are :
1.Coal (10.33%)
2.Crude oil (8.98%)
3.Natural gas (6.88%)
4.Refinery products (28.04%)
5.Fertilizers (2.63%)
6.Steel (17.92%)
7.Cement (5.37%)
8.Electricity (19.85%)